The vast majority of traders use the standard candlestick chart. But what if we told you there was another type of chart that could be even easier and, in some cases, even more assertive? Find out everything you need to know about the Heiken Ashi chart in our article.
When looking through IQ Option‘s menus, you’ve probably come across the Heiken Ashi chart option. As we said in the first sentence, we think it’s important to point out right from the start that Heiken Ashi is not a strategy, but a type of candlestick chart.
Like any tool at your disposal on trading platforms such as IQ Option, it is appropriate for certain types of situations and it is important to understand whether it makes sense for your strategies and operations.
So check out our full explanation and details of the Heiken Ashi chart. If you’re just starting out in trading, it’s very likely that this type of chart could make sense to you because it’s so easy to read and combine with strategies.
Video
How the Heiken Ashi chart works
Unlike the standard candlestick chart type, the Heiken Ashi chart filters out market noise, making it much easier to read, as it helps to demonstrate trends in a much more practical way.
As the name suggests, its origins are Japanese and it has been around for 300 years, which means it appeared long before any modern trading platform, but it is still one of the main types of charts in existence.
As the name suggests, its purpose is to show the average price of the asset in question. This makes it much easier to see trends, making it possible to make trades even without the use of indicators.
How to insert the Heiken Ashi chart into IQ Option
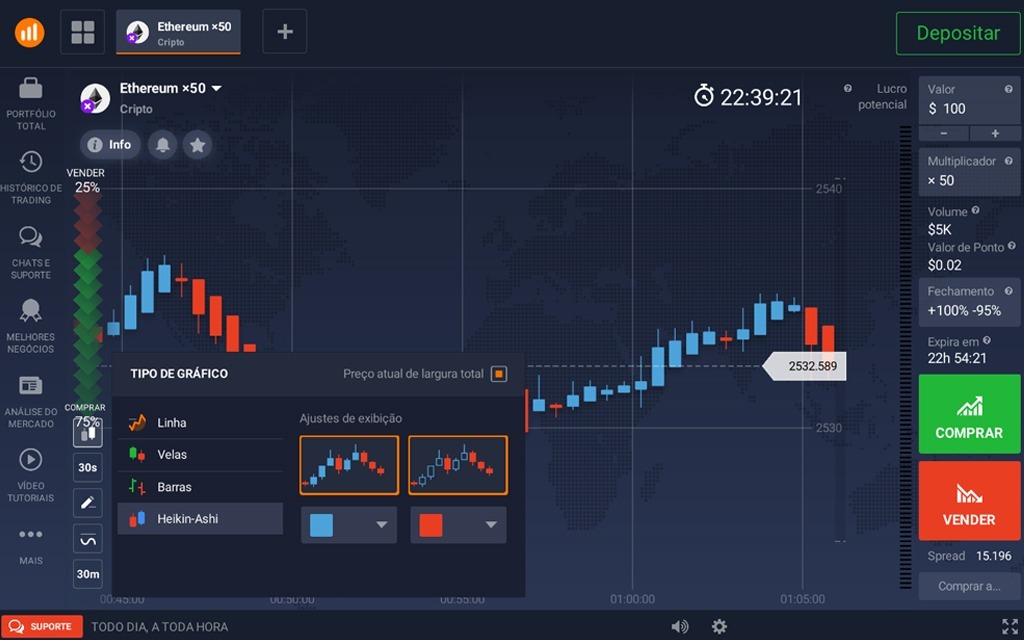
Using the Heiken Ashi chart in IQ Option is quite easy. On the bottom left-hand side of the chart, the first of the five options is “chart type”. Just click on it and you’ll see that there are 4 options available. The Heiken Ashi chart type is the last one, just select it.
Setting it up is also quite easy as the only adjustment available is the color of the candles that represent high and low. We recommend using colors that are easy for you to associate with.
How to trade the Heiken Ashi chart on IQ Option

As mentioned above, you can trade using the Heiken Ashi chart on its own, without using indicators. To do this, you must first know how to read the candles and understand which moments allow you to make trades with the greatest chance of winning.
Below, we’ll list the main signals you should look out for before making a trade using the Heiken Ashi chart on IQ Option:
Candle sizes
The size of the candles is directly proportional to the strength of the trend. In other words, large bullish or bearish candles in sequence indicate a strong trend, while small candles without much direction indicate consolidation or sideways movement.
Candle shadows
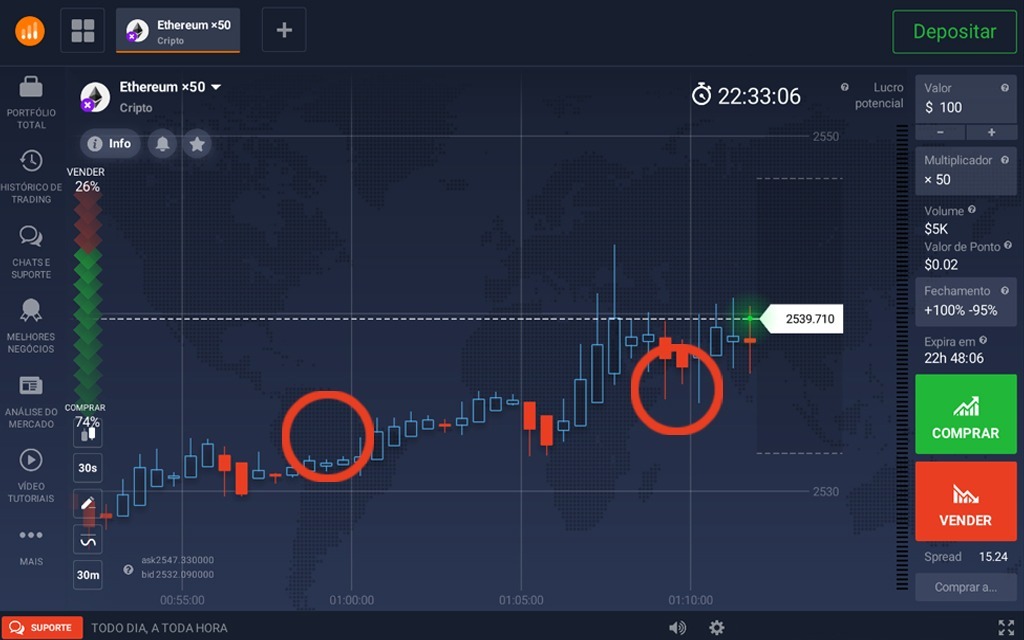
The shadows of the candles on the Heiken Ashi chart are also important for identifying the strength of the trend. If the candles leave little or no trace, it indicates a very strong trend, which could be a good time for a short-term trade.
Long shadows in a row may indicate a change in trend, which is not a good time to make a trade. But if this change does occur, you may be able to take advantage of the fact that you caught it right at the start of the movement.
Other ways to use the Heiken Ashi chart in IQ Option
Using just one indicator to make your trading strategies is not usually recommended because no indicator is assertive enough on its own. Now, making your trades using only the chart as mentioned above is even less recommended (although it can bring results), so we recommend combining the Heiken Ashi chart with at least one indicator for your financial market trades.
Heiken Ashi + RSI chart
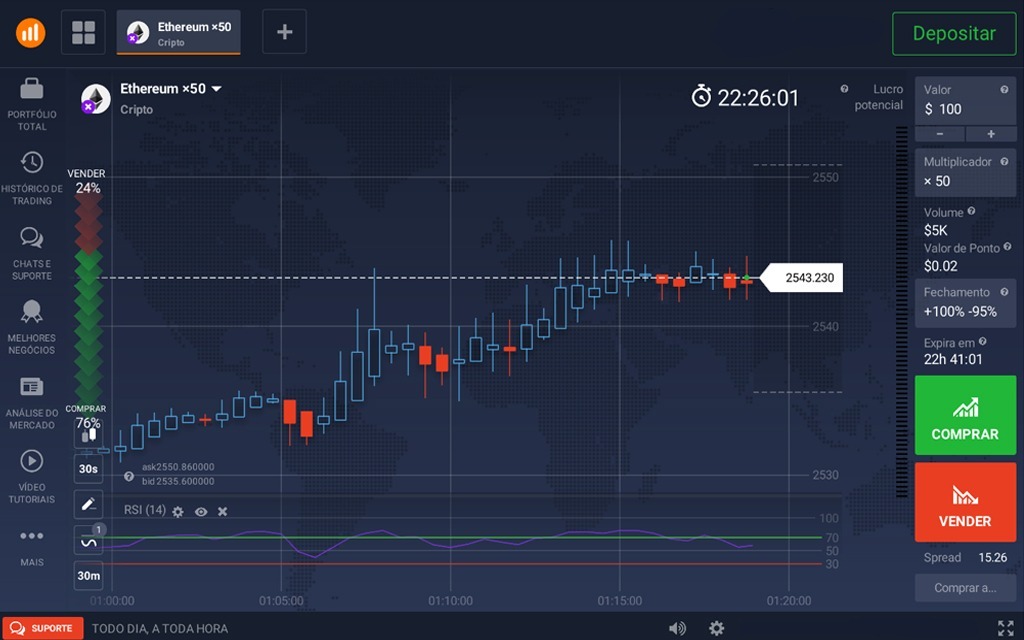
Combining the Heiken Ashi chart with the Relative Strength Index (RSI) can give you the security and assertiveness you need in your trading.
This indicator measures the speed and strength of price movements and indicates possible overbought and oversold positions. The RSI is presented as a percentage from 0 to 100%, where the lower it is the more oversold and the higher it is the more overbought.
However, in this case we want to highlight the middle line of the Relative Strength Index, which is 50%. The crossing of this 50% range, whether from minus to plus or the opposite, is a very strong indication of a change in trend and if the Heiken Ashi chart also shows this in its candles, it is a sign that a good level of assertiveness can be expected using both.
Advantages and Disadvantages of the Heiken Ashi Chart on IQ Option
It’s important to emphasize that there is no ideal indicator or chart that guarantees 100% success in trading. In fact, if anyone promises you a 100% chance of winning, walk away, as it is impossible to be sure of success in this market.
All existing tools have their strengths and weaknesses, and understanding them is fundamental to developing or improving your trading strategy.
Below, we’ll mention the advantages and disadvantages to help you understand whether or not it’s worth using them in your trading on a platform like IQ Option.
Advantages
Spotting trends on a standard candlestick chart may not be very easy, since price fluctuations often don’t jump out at you and questions such as trend become interpretive. Incidentally, this type of chart also helps in understanding price volatility.
Disadvantages
Due to adjustments to smooth the reading of the chart, the opening and closing price information as it is represented in the candlestick chart type is not available. As a result, shorter trades, such as 1-minute trades, can be hampered and not be as accurate, unless the market has a very strong trend and volatility.
Another negative factor is the absence of price gaps, which can hinder the trader when making trades using the Heiken Ashi chart on IQ Option.
After reading this article, you can learn how to trade the IQ Heiken Ashi chart with a demo account on the IQ Option platform, and get to know the most interesting trading strategies.