Do you trade on the trend? Then pay attention to the Average Directional Index. This indicator answers four essential questions.
- Where is the trend going?
- How strong is the trend?
- Are there potential changes in market volatility?
- What are the best entry and exit points?
Let’s see how it works and how to apply it on the IQ Option platform.

What is the ADX?
The ADX is a technical indicator that was created more than 40 years ago. Millions of traders still use it to get market signals. The ADX shows whether the market is in a strong trend that can bring profit.
The index works best when combined with two additional indicators.
- Positive Directional Indicator (+DI). It indicates how strong the uptrend is.
- Negative Directional Indicator (-DI). It shows the strength of the downtrend.
The IQ Option platform combines the three indicators by default for users’ comfort. Together, they form a powerful trend trading strategy.
Here’s what you’ll see on the platform.
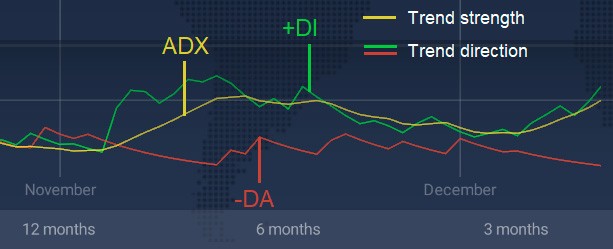
Average Directional Index: yellow line.
Positive Directional Indicator: green line.

Negative Directional Indicator: red line.
How to read the ADX lines?
The ADX strategy provides three important metrics. The yellow line shows whether the trend is strong enough. The green and red lines show whether it is rising or falling. The intersections of the red and green lines indicate reversal points.
Let’s take a closer look.
Use the ADX to define strength
The yellow ADX line only shows the overall strength of the trend. This is important information because it defines the amount of potential profit/loss. The stronger the trend, the higher the Index.
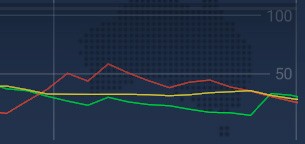
Traders estimate the ADX value on a scale of 0 to 100.
- From 25: strong.
- Between 50 and 75: very strong.
- Above 75: super strong.
- Below 25: weak or absent.
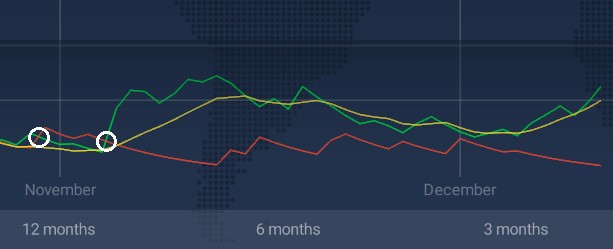
Let’s try reading the lines. This example is for Tesla shares.
The yellow line is slightly above 25. This means that the trend is strong (but not too strong).
Use the ADX to discover direction and detect reversals
Let’s take a closer look at the Tesla stock chart. Look at the green and red lines. What do you see?
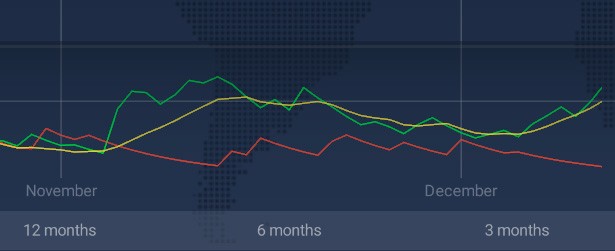
+DI is above -DI: dominant uptrend.
-DI is above +DI: dominant downtrend.
-DI and +DI cross: reversal trend.

In the picture above, we can see that the trend is up. This is a strong buy signal. In the opposite situation, you should sell.
The example shows us that the trend for Tesla shares reversed twice: in November and December.
How to set up the ADX indicator on the IQ Option platform
- Log in to your IQ Option account.
- Add a desired asset in the top panel.
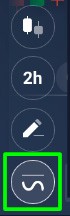
- Go to the Indicators section. It is located in the bottom left-hand corner of the Trading Room.
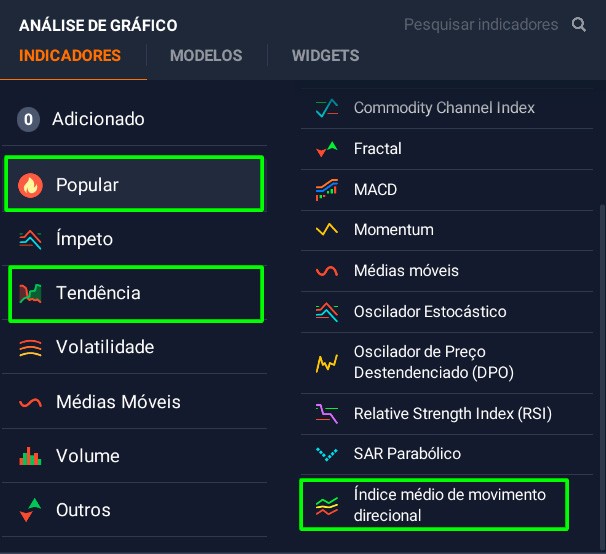
- Go to the Popular or Trend tab. Select the “Average Directional Movement Index”.
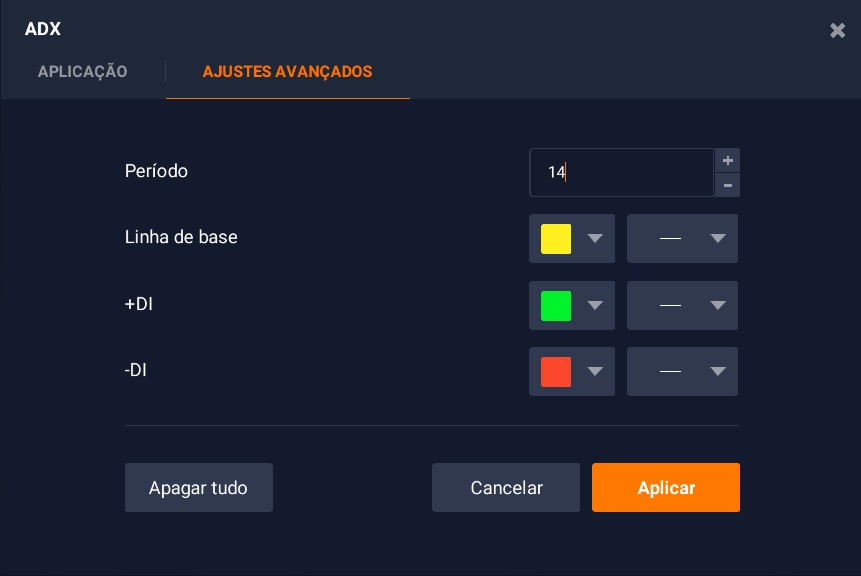
- Configure the settings. The default period is 14. This is an ideal value for most cases. You can increase it if you like. Then the Index will be more sensitive to market changes, but also less accurate.
- Press “Apply”.
No indicator can make 100% accurate predictions. The ADX is a truly powerful tool. However, sometimes the market can move faster than the ADX. Then you may receive late signals. Use the Demo Account when trying out the indicators for the first time. This will help you practice reading your data. Only use the ADX to make real predictions once you know how it works.
After reading this article, you can get to know the ADX indicator better with a demo account on the IQ Option platform, and learn about the most interesting trading strategies.