Trading on the financial market can be daunting for beginners because of the sheer number of tools and indicators available on platforms like IQ Option. The variety really is huge and learning how they all work can take a long time, so we’ve highlighted 3 important trend indicators to get you started.
Like an airline pilot, the trader also has a number of instruments at his fingertips, which he must learn to operate if he wants to be successful.
The good news for traders is that, unlike pilots, they don’t have to master all the instruments available to them and that, fortunately, no one’s life is at risk if they make a mistake (apart from their own pocket).
Jokes and comparisons aside, it is a fundamental element of trading to know and master certain tools and indicators in order to develop strategies and thus become a successful trader.

What is the best trend indicator?
In this article, our aim will be to show and explain some of the best indicators on IQ Option, one of the most popular and accessible platforms for trading on the financial market.
- RSI
- Bollinger Bands
- Stochastic Oscillator
Why use trend indicators on IQ Option?
Just reading the charts is not enough to be more assertive in your financial market operations. Indicators have been developed with the aim of providing a great deal of important market information in a simple way, and are fundamental to making trading decisions.
It is important to emphasize that there is no indicator that will make you money on every trade, but the indicators at IQ Option help you, for example, to see trends, which helps to increase your chances of success.
Aligned with principles such as support and resistance, trends can pave the way for many winning trades. Below, we’ll highlight and explain 3 of the best IQ Option indicators for this purpose.
RSI
The RSI (Relative Strength Index) works on the concepts of overbought and oversold.

It measures the speed and magnitude of directional price movements. Its purpose is to measure the intensity of purchases and sales of a given asset, to indicate overbought and oversold signals.
This index is expressed as a percentage, which ranges from 0 to 100% and is usually represented by a single line on a chart. The closer it is to 100%, the indication of overbought status, which is usually referred to as overbought when it is greater than 70%.
When to use the IQ Option RSI indicator?
At IQ Option, the RSI is interpreted using the concepts of overbought and oversold, as mentioned above.
The readings on the buying and selling forces can help you make better trades at the points where the RSI line reaches these important zones (30 and 70%, generally), because the most important thing to look for is the trend reversals that this indicator provides when this occurs.
When its line moves from an oversold zone to an overbought one, it’s a strong indicator that you should buy the asset in question. However, the RSI indicator on IQ Option (and the other platforms) should not be used alone, according to experienced traders.
Bollinger Bands
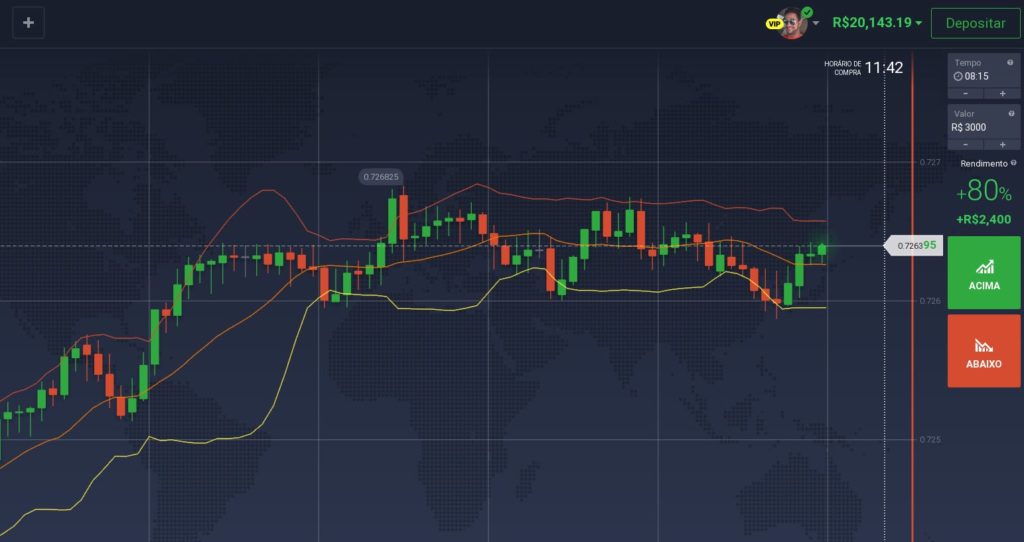
One of the most recommended indicators to use in conjunction with the RSI is the Bollinger Bands. And not necessarily just with the RSI, you can use this IQ Option indicator with others.
Bollinger Bands usually consist of 2 bands (upper and lower), plus a central one, which is the 20-period moving average. The bands at the ends are calculated on the basis of the standard deviation of this moving average and demonstrate volatility in the market in a practical way.
They are good for demonstrating trends and showing opportunities in advance, which is very valuable for the trader, as well as helping to avoid trading at times of high volatility.
When to use Bollinger Bands on IQ Option?
It’s easy to set up this indicator on IQ Option, which is why we recommend that you at least have it ready to use when you want to be more certain about the volatility of the markets.
A narrow channel represented by this IQ Option indicator shows a great balance in the market, which can be preceded by a strong trend, and can be a great ally for longer trades if the trend starts to manifest itself.
Another important signal that this indicator can give is when the price line crosses one of the borders, as this can be an indication that the price is likely to continue in this trend, where when it rises, it is indicative of strength and when it falls, it shows weakness.

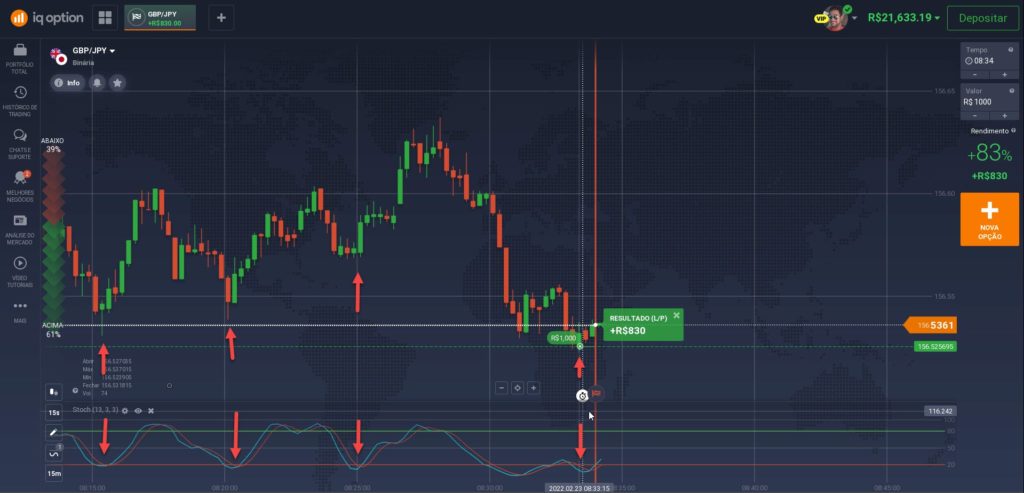
Stochastic Oscillator
Stochastic is one of traders’ favorite IQ Option indicators. Interestingly, its name comes from the Greek and can mean “target” or “guessing”.
It only takes into account the highs and lows of the asset’s price and tries to point out changes in trends over a given period of time.
It consists of two horizontal lines and two moving average lines (one fast and the other slow). The first has a period of 3, while the slow one has a period of 13. It also has an oscillator, which starts from 0 to 100 and has markings at the 20% and 80% levels.
As with the RSI, when the two moving averages are above the 80% mark, this IQ Option indicator points to an overbought zone, while below 20% it means the opposite, representing an oversold zone.
When to use the Stochastic Oscillator on IQ Option?
If you identify both moving averages above the overbought level, a downtrend is expected. You just have to be careful because this may not happen immediately, it’s possible that the market will remain bullish for some time, so don’t bet on it falling immediately.
You should also watch for the slow moving average crossing below the fast one, as this can also indicate a downtrend. When this crossover occurs above the slow moving average, it’s a sign that the opposite may soon occur.
When the IQ Option indicator and the price diverge, i.e. go in different directions, it could be a sign of a reversal, which could be bearish or bullish.
After reading this article, you can learn how to identify trends with a demo account on the IQ Option platform, and get to know the most interesting trading strategies.