Most traders use support and resistance in their financial market operations, but do they work? Understand the definition of these terms, how they work and how to use them on a platform like IQ Option.
Support and resistance are one of the most basic concepts in graphical analysis for any type of market. If you still don’t understand these concepts very well, don’t worry, we’ll explain them in more detail here and you’ll be able to use them on brokers like IQ Option.
If you already have a good knowledge of support and resistance in IQ Option and other markets, this article may also be useful for you, as we’ll discuss in more detail how the strategies with which these concepts are very applicable.

Podcast – What are support and resistance lines?
What is IQ Option support and resistance?
We can explain support and resistance as the edges of a channel that the price of a given asset “respects”. More practically, imagine that the price of a certain asset was initially quoted at 50, after which it oscillated between and sometimes touched 45 and 55, without falling below the minimum or exceeding the maximum.
The bottom of this oscillation is called support and the top is resistance. Knowing this concept is important, because even after decades of trading, many prices end up respecting support and resistance, and best of all, you can take advantage of this to profit.
Why are support and resistance important in IQ Option?
As we explained earlier, the prices of all assets often respect support and resistance. And even when they don’t, there are opportunities and strategies to take advantage of them, such as pullbacks.
Something important to bear in mind is that there are no indicators or tools that automatically bring up support and resistance on IQ Option. But don’t worry, with a little practice and chart reading it’s not difficult to learn the most relevant support and resistance zones for a given timeframe.
Should I bet that it rises at support and falls when it touches resistance?
This is an idea that can make sense and often works, especially when the price is respecting the supports and resistances on the IQ Option chart. However, it is impossible to predict the future movement of an asset’s price, even if it reaches an important zone that suggests that the price is likely to rise or fall next.

As trading is about probabilities, you should combine the reading of support and resistance with other indicators, such as those that indicate overbought and oversold levels. It’s also important to analyze the trends, moving averages and volatility of the asset.
Make your decision based on the confirmation of more than one indicator and in this way you will tend to be more assertive and a profitable trader in the long term.
How to make IQ Option support and resistance?
The first thing you should pay attention to is the chart timeframe, choose the one most compatible with the timeframe you plan to trade.
After that, take a look at the most recent candles (they are more important) and look for common points where the price has respected both an upper limit (resistance) and a lower limit (support).
In tools, select and use a line to draw these support and resistance zones on your IQ Option chart.
It’s important to take into account previous trends to this plotted channel, as the price may have come from an uptrend or downtrend, which could indicate a confirmation or reversal.
If the price is very respectful of these support and resistance zones on IQ Option, making trades when the candles touch these zones can be more assertive.
Indicator for support and resistance in IQ Option

As we mentioned earlier, the best way to identify support and resistance on IQ Option is through graphical analysis. However, there are indicators that take other aspects into account and create new channels through which the price flows, providing you with important information, such as trends.
There are some indicators that work very well in conjunction with support and resistance, and in this article we’ve chosen to look at just one of them:
Bollinger Bands
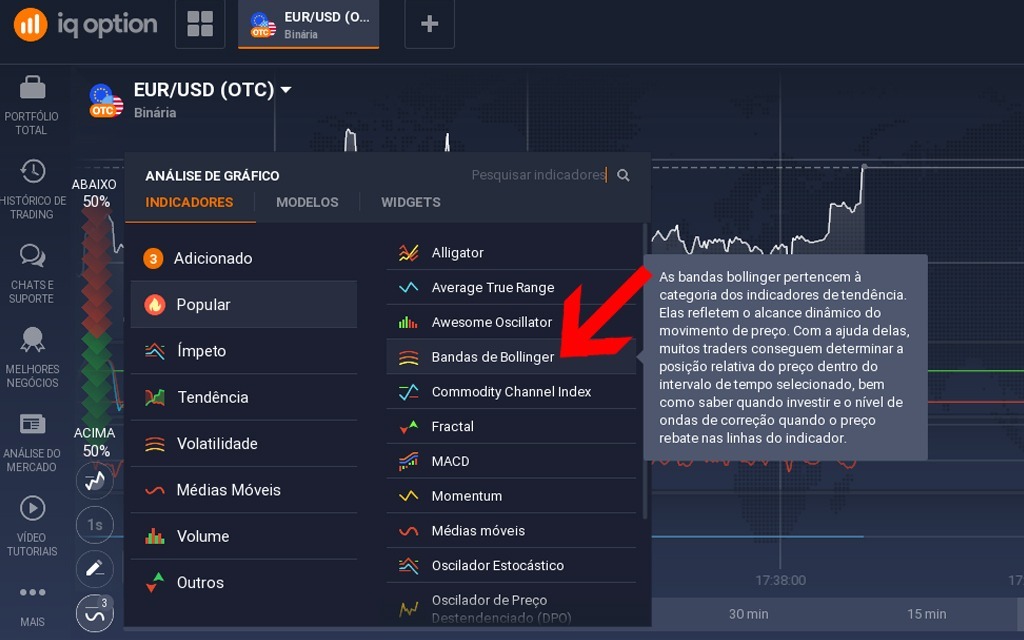
They consist of 2 bands (upper and lower), plus a central one, which is the 20-period moving average. The bands at the ends are calculated on the basis of the standard deviation of this moving average and demonstrate volatility in the market in a practical way.
They demonstrate trends and show opportunities in advance, which is important for helping you make decisions within a support and resistance channel on IQ Option.

If this indicator shows low volatility, it is likely that the asset’s price will respect the supports and resistances, increasing your degree of assertiveness for the channel in question.
Support and resistance strategies on IQ Option
Separamos abaixo duas das mais estratégias mais populares entre os traders nas quais suporte e resistência na IQ Option são elementos fundamentais para suas aplicações. Confira a seguir:
Pullback
A pullback is the opposite movement of the market after a big price swing that brings it back to the natural trend.
To be more assertive in a pullback, you should look for big swings in the market. Pullbacks are common after big rises and falls in price.
The pullback is a good strategy with supports and resistances on IQ Option because they are fundamental for activating this movement and when it occurs, the oscillation is usually enough for you to win the trade.
Fibonacci
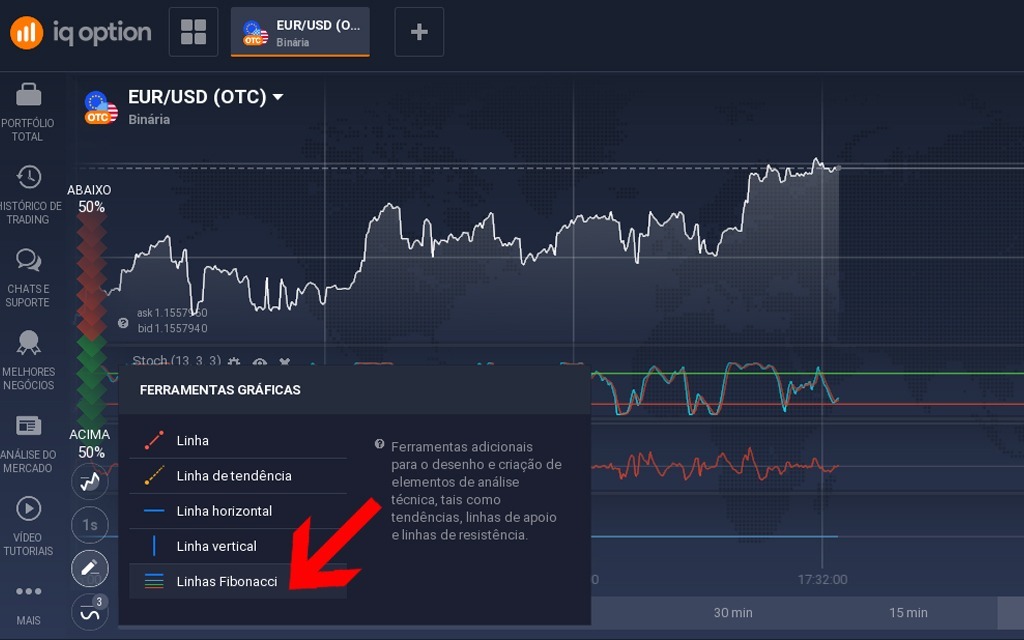
Fibonacci is one of the most famous and popular strategies among traders. It is a graphical tool based on the Fibonacci sequence and ratio, which is present not only in mathematics, but also in various other elements of life, including shapes in nature.
The number in question is the ratio of 1.618 and the proportions distanced by it represent important reversal points in the price variations on the chart of the most varied financial assets. These are: 23.6%, 38.2%, 50%, 61.8% and 100%.
Support and resistance in IQ Option are fundamental to the strategy in order to make the necessary markings for the application of this strategy. Fibonacci is usually most assertive when an asset breaks through an important support or resistance, which indicates a considerable price change.
After reading this article, you can learn how to use support and resistance with a demo account on the IQ Option platform, and get to know the most interesting trading strategies.